Research contents
3.1.1 Experiment for two-phase flow in the heat transfer tube of FBR
Two-phase flow test in the heat transfer tube
R & D activities have been starting at JAEA for the practical application of the next generation FBR cycle technology. From the viewpoints of lowering breakage rate and easy maintenance, the next generation FBR system adopts a steam generator (SG) with straight double-walled heat transfer tube, shown by Fig. 2.1.4. As this SG adopts the design strategy that no orifice admitted before the inlet, the flow instability in the heat transfer tube is of the most concern. As the first step to reach the concern, the verification and improvement of the existing thermal hydraulic correlations for the design code are very important. Therefore, JAEA started the thermal hydraulic tests under high pressure with using a circular tube for the purpose of collecting the data of heat transfer, pressure drop and so on.
Figure 2.1.4 gives the general image of the SG. It is 38 m in height and 3.2 m in diameter. With using 7100 straight double-walled heat transfer tube, the SG is expected to have a total heat exchange of 1765 MW. In the SG, high temperature sodium flows up down the out side the heat transfer tube and water flows down up inside the tube. With the heat transferred from Na side, the subcooled water turns to water-vapor two-phase flow and then the over-heated vapor at exit. The effective heating length is 29 m. The designed operating pressure is up to 19 MPa.
The image of the test section is shown in Fig. 2.1.5. The test section is a circular tube with an inner diameter of 11.6 mm. The whole height of the test section is about 13.4 m. The test section simulates the mid part of the SG where water-vapor two-phase flows. The test section is axially divided into three levels that are heated separately with three radiation heater. Wall temperature, pressure drop and void fraction are measured at the end of each level. The tests are conducted at 15-18 MPa in pressure, 40-200 g/s in flow rate and 150-250 kW/m2 in heat flux.
Figure 2.1.6 shows an example of measured distributions of temperature at 17 MPa in pressure. At the mid level, wall temperature rises due to the occurrence of dryout. By using these data, the correlations of heat transfer, pressure drop and so on are verified.
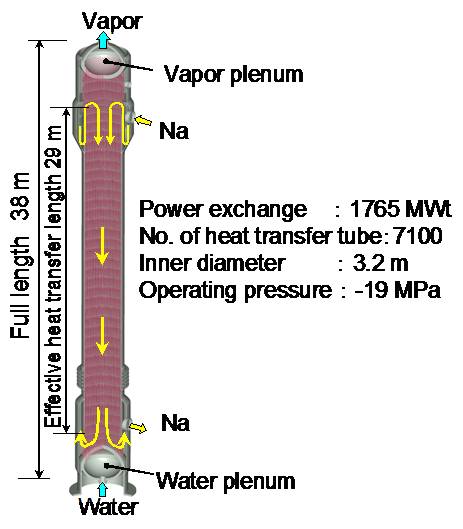
Fig. 2.1.4 Image of the SG with straight double-walled heat transfer tube for FBR
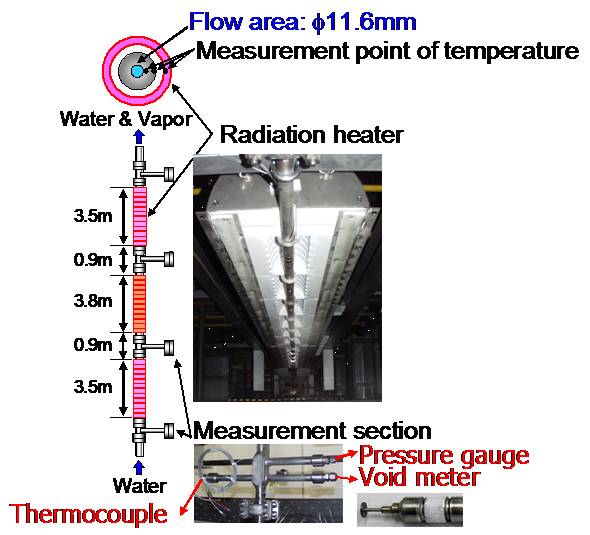
Fig. 2.1.5 Test section
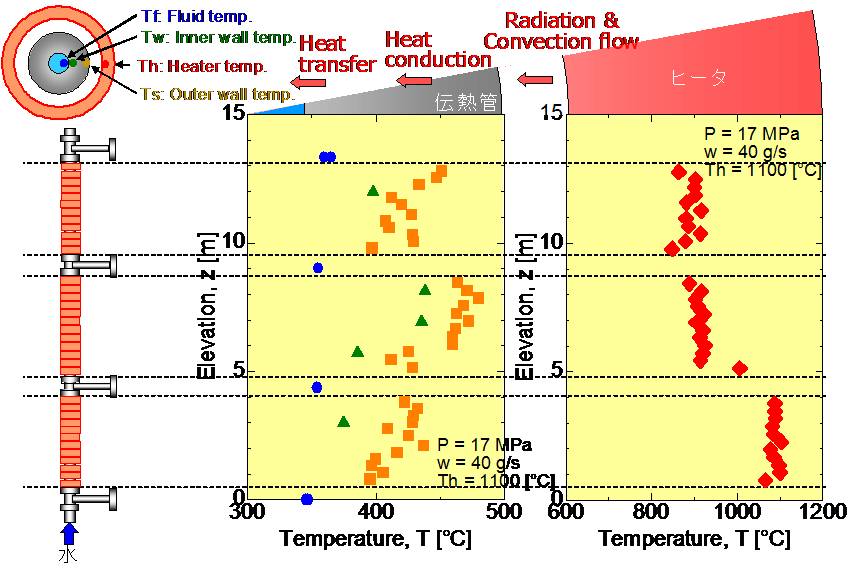
Fig. 2.1.6 Measured result of distribution of temperature(P=17MPa, w=40g/s)