Research contents
3.2.2 Experimantal estimation for the Effect of Axial Power Distribution on Critical Power
(1) Backgrounds and Objectives
A new reactor concept of an Innovative Water Reactor for Flexible Fuel Cycle (FLWR) is under development at the Japan Atomic Energy Agency (JAEA) in cooperation with Japanese reactor suppliers. The FLWR core is characterized by a double - humped short flat core, a tight lattice arrangement of fuel rods, low mass velocity and high in - core void fraction. To date, R&D investigating the thermal - hydraulic performance of the tight - lattice rod bundles has taken place at JAEA.
The basic thermal - hydraulic characteristics of critical power and pressure drop, under both steady and transient conditions, have been ascertained using 37 - rod tight - lattice bundles. The effect of a spacer on critical power has also been ascertained. However, for the axial power distribution, the most severe one - which is given in Fig. 2.2.8- was selected for these experiments, with no consideration given to the change in axial power distribution as burnup proceeds. And hence research on the effect of axial power distribution on critical power is necessary.
With critical power in the positive quality region under axial non - uniform heated conditions, there are basically two kinds of concepts for use in summarizing the Boiling Transition (BT) occurrence mechanism: the local conditions concept and the overall power concept. The so - called local conditions concept states in essence that only the local heat flux and local quality control the BT. Correlations based on the concept are generally written in the form of cBT = f (qBT). In contrast the overall power concept implies that the upstream history is quite important.
Correlations based on the concept are written in the form of cBT = f (LB). Conventional BWR correlations are based on the overall power concept. The concept was reported as reasonably well for a number of sine and cosine wave profiles. However, research by Barnett revealed that the concept was not always valid for different heat flux profiles. Typical correlations based on the overall power concept include the CISE correlation, Biasi correlation, Arai correlation, etc. On the other hand, the Lee correlation, Barnett correlation, etc, are based on the local conditions concept. Besides the above two types of critical power correlations, in recent years, a combination of the overall power concept and the local conditions concept was also reported for use with critical power correlations. The diversity of the correlation methods made the authors interested in ascertaining which one would prove effective.
To ascertain the effect of the axial power distribution and an effective method of correlating critical power in the positive quality region in axial non - uniform heating conditions, basic model experiments were performed at atmospheric pressure using a circular tube for several axial non - uniform heating conditions. Using the newly derived critical power data, the local conditions concept and the overall power concept were evaluated and the appropriate correlating method for critical power in the positive quality region in axial non - uniform heating conditions was recommended.
(2) Experiment
1) Determining the Axial Power Distribution Profile
To conduct this research, axial power distribution profiles first needed to be determined. Selection was based on the basic axial power distribution profile of the FLWR. The basic power distribution profile, as given in Fig. 2.2.8, can generally be divided into 5 layers. Here, exposing the upper three layers and the center three layers from the basic heating case, as given in Fig. 2.2.9, results in “the upper three - layer simulation” and “the center three - layer simulation” heating conditions, respectively. In this research, the above two heating cases, together with an axial uniform heating case, were selected for detailed evaluation.
2) Experimental Results
An example of test results are shown in Fig.2.2.10, where the changes in critical quality with changes in the maximum relative power ratio (Rmax) are plotted. For the center three - layer simulation heating condition, the critical quality decreased with the increases in Rmax. However, the decreasing tendency slowed down with high Rmax. On the other hand, for the upper three - layer simulation heating condition, with increased Rmax, the critical quality first increased. It reached a peak with an Rmax of around 5 to 6 and then began decreasing. There is a tendency for changes in critical power tendency to be accompanied by a change in when BT occurs. In the region where Rmax is lower than 5, the BT is observed to occur at the exit of the test section. However, when Rmax is higher than 5, the BT is observed to occur at the exit of the center layer. Corresponding to this change in BT point, the critical quality, critical heat flux and boiling length also significantly change. The green shaded regions in the figure give the changing area of the relative power ratio in the designed FLWR fuel assembly.
3) Discussion
In this research, we verified the local conditions concept and the overall power concept with using the newly derived data. As given in Figs. 2.2.11, the center three - layer simulation heating data and the upper three - layer simulation heating data were used to verify the overall power concept. The dashed line in the figure was a typical curve drawn for the concept. The characteristics of the curve are:
(1) It runs through the (0, 0) point of the LB - cBT coordinates. (2) Critical quality increases with increased boiling length, but the increasing tendency drops with a high LB. Using the figure, it can be observed that although some of the upper three - layer simulation heating data correlates with the concept, the other upper three - layer simulation heating data and all the center three - layer simulation heating data revealed a tendency that did not correlate with the concept.
In Fig. 2.2.12, the data plotted in Fig. 2.2.11 was re - plotted using the local conditions concept with the qBT - cBT coordinates. The dashed line in the figure was a typical line drawn for the concept. The curve was characterized by a negative slope, which means critical quality decreases with increased critical heat flux. The center three - layer simulation heating data and the part of the upper three - layer data that did not correlate with the LB - cBT coordinates in Fig. 2.2.11 do correlate with the qBT - cBT coordinates in Fig. 2.2.12. However, the upper three - layer simulation data that did correlate with the LB - cBT coordinates in Fig. 2.2.11 did not correlate with the qBT - cBT coordinates. This revealed that (1) both the two concepts are capable of correlating part of the data, but (2) neither of the concepts applies to all the data and (3) the two concepts, which have been considered to contradict each other, actually complement each other.
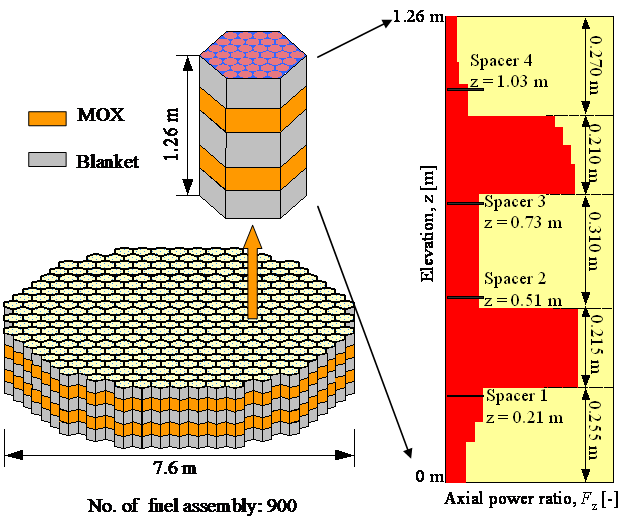
Fig. 2.2.8 Fuel assembly and basic axial power distribution profile in the 1356MWe FLWR
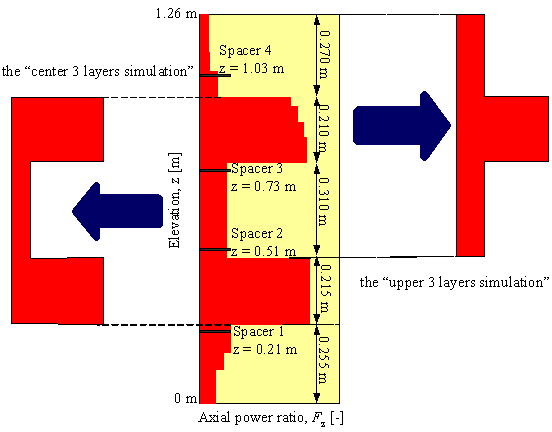
Fig. 2.2.9 Detailed evaluation cases for the research
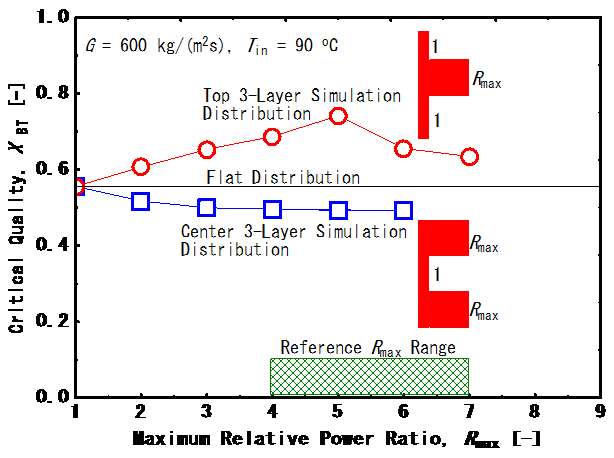
Fig. 2.2.10 The effects of axial power distribution profile and maximum relative power ratio on the critical quality
Fig. 2.2.11 Plots of upper three - layer and center three - layer simulation data on LB - cBT coordinate
Fig. 2.2.12 Plots of upper three - layer and center three - layer simulation data on qBT - cBT coordinate