Research contents
2.2.1 Experiment for boiling heat transfer
Quantitative Evaluation of Boiling Flow
Boiling Liquid film flow down experiment was conducted to get the validation data for the detailed two-phase flow analysis code TPFIT. The outline of the test section is shown in 2.2.1. The width of the flow area was 12mm. A slit was used to form a liquid film on the surface of the flow area. The non-heated run-up region from the inlet to the beginning of the heated area was 139mm. The heated surface was rectangular whose size was 150mm×10mm. Experiments were performed when flow rate was 0.4 kg/min, inlet temperature was 84℃. The test section was set with a lean of 60°(angle from the vertical). As one example of the test results, liquid film behavior when heater output was 1400 W was shown in Fig. 2.2.2.
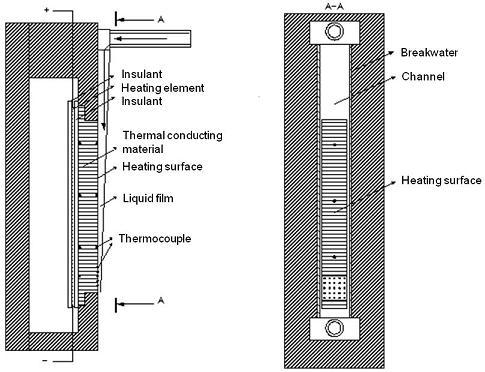
Fig. 2.2.1 Schematic view of test section
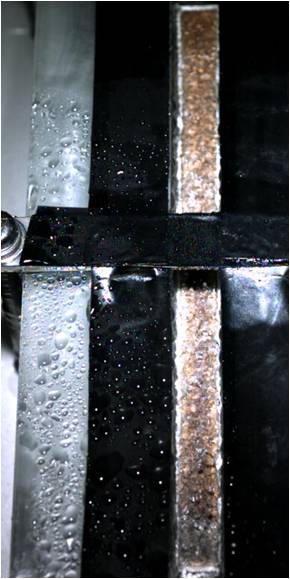
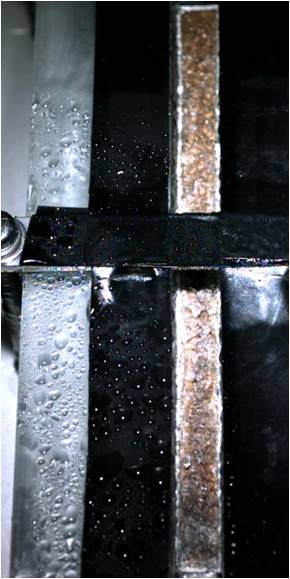
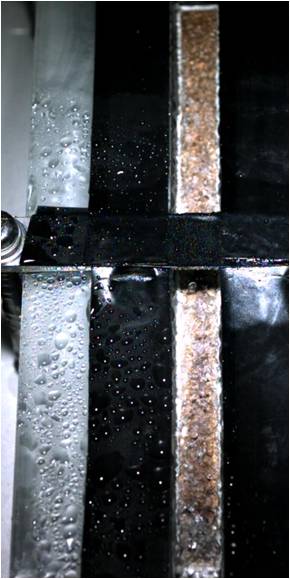
Image at -0.1s Image at Trigger point Image at +0.1s
Fig. 2.2.2 Example of measured image
Research on boiling phenomena
(1) Background
Compared to single phase heat transfer, nucleate boiling has extremely high heat transfer coefficient and is wildly used in heat exchanger, boiler, BWR, etc. So far, nucleate boiling has been researched a lot and is still of great importance.
Nucleate boiling is a complicate phenomenon that is consisted by bubble generation, growth up and departure. The heat transfer mechanism in the process is quite a complicate one. Heat transfer coefficient changes 4 dimensional if time axis is included. Conventional evaluation of the heat transfer coefficient uses a gross value averaged both spatially and timely. This kind of correlations is far from satisfied because they are restricted to its adaptation range.
In recent years, another kind of approach has been tried with considering the heat transfer mechanisms in a bubble cycle. Heat transfer coefficient is calculated theoretically or semi-theoretically basing on the proposed heat transfer mechanisms. For the heat transferred by evaporation underneath a bubble, there are theory that evaporation proceeds averagely in micro layer underneath the bubble and theory that evaporation concentrates in wedge shape area of micro region. The two theories are schematically shown in Fig. 2.2.3 (a) and Fig. 2.2.3 (b), respectively. To evaluate these theories, there is a need to measure the distributions of surface heat flux and surface temperature underneath a bubble with high resolutions both spatially and timely. Presently, because there has great difficulties to do this, all theories cannot be verified and keep being hypotheses.
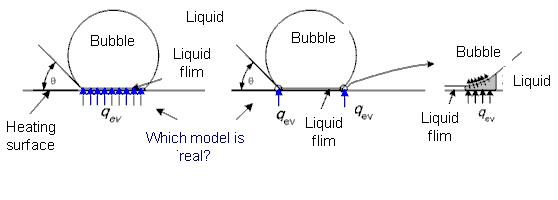
Fig. 2.2.3 Heat transfer mechanism by evaporation
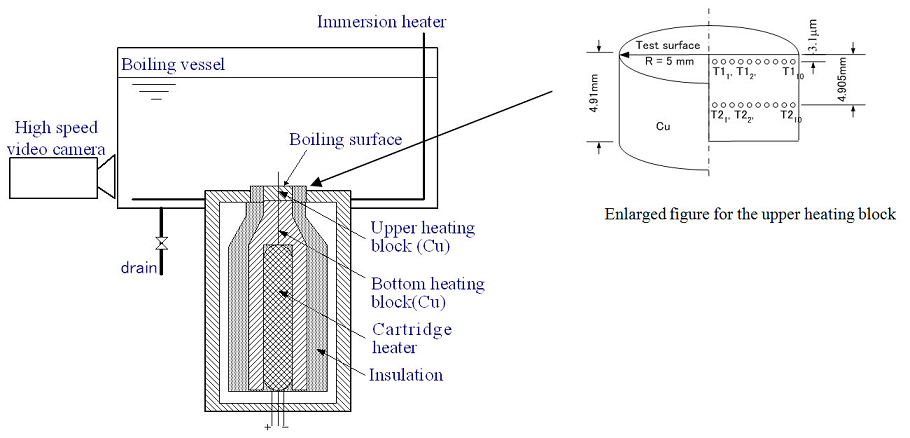
Fig. 2.2.4 Experimental system
(2) Objective
In this research, to validate the existing boiling models, we tried to measure surface heat flux and surface temperature in a boiling process with high resolutions both spatially and timely. To do this, special T type micro thermocouples were developed to measure inner block temperatures with high spatial resolution and inverse heat transfer problem was solved to get surface heat flux and surface temperature.
(3) Experimental system and Method
1) Experimental system
Experimental system is outlined in Fig. 2.2.4. It includes a boiling vessel and a heating block. The heating block is made of copper and is insulated peripherally. The heating block is composed by two parts, the upper one and the bottom one. The upper one is a test piece with 20 special T-type thermo sensors implemented. The thermocouples on each layer share a common positive pole made of Cu. The technology was developed in the part of 3.1. The upper heating block has a diameter of 10mm and a height of 4.91mm. The upper and bottom heating block were joined together with a high temperature adhesive. A cartridge heater is inserted into the bottom heating block, which has a maximum power output of 500W. As introduced above, in the upper heating block, totally 20 micro thermo sensors were installed at two layers to measure inner block temperatures at depth of 3.1mm and 4.905mm from boiling surface. The boiling surface has a roughness of about 1mm.
To observe vapor-liquid behaviors on the boiling surface, a high-speed camera was equipped. A triggering signal can be produced to start the high-speed camera and temperature recording at same time. Thereby, a time correspondence is constructed between video images and temperature data. Data sampling rate was set at 1000 or 2000 Hz according to heater power and bubble generating velocity. The camera was set at the same recording rate as the data sampling rate.
2) Experimental condition
Experiments were performed at atmospheric pressure in steady state. Pool water was maintained at saturation temperature. To start an experiment, first heats water in boiling vessel to saturation temperature. Experiments were conducted by increasing the heater output step by step.
3) Experimental result
Samples of data taken by the micro thermocouples on the two layers were shown in Figs. 2.2.5 and 2.2.6. The micro thermocouples sharing a common positive pole on each layer was confirmed can be used in the temperature measurements in Fig. 2.2.5. T1 is the temperature measured at the layer 3.1mm beneath the boiling surface. T2 is the temperature measured at the layer 4.905 mm beneath the surface. T1 changes much more significantly than T2 because it locates near to the boiling surface and can catch the temperature change in the boiling process in detail while T2 is too far to catch detail change.
In Fig. 2.2.6, the change of T1 is divided into two regions, t1, and t2, respectively. t1 is a time period with generally unchanged temperature and t2 is a period in which a sudden decreasing and then a recovering of temperature were observed. The big decrease of temperate in t2 was confirmed corresponding to a formation and detachment of a big bubble.
The data taken at T1 were used as the input in solving 1D IHCP problem to get surface heat flux and surface temperature. The result is shown in Fig. 2.2.7. Changes of surface heat flux and surface temperature in a boiling process were gotten. The peak of the heat flux corresponds to the formation and detachment of the flat big bubble in time period t2.
Fig. 2.2.5 Measured inside wall temperature at depth 0.0031 mm and 4.095 mm from the boiling surface
Fig. 2.2.6 Measured inside wall temperature at depth 0.0031 mm and 4.095 mm from the boiling surface
Fig. 2.2.7 Changes of surface heat flux and surface temperature in boiling process